We’ve updated the Temp Free Stats for the Big Ten (conference games only). You can find them here.
Showing posts with label conferenceStats. Show all posts
Showing posts with label conferenceStats. Show all posts
Tuesday, February 10, 2009

Thursday, February 5, 2009
Big Ten By the Numbers 2008-2009
Update: We've been slacking on this project for the 2008-2009 season, but we’ve finally gotten things squared away so we can post the data. Here are the numbers, current through 2/9/2009.
We have a little project here at SaWA to be able to look at stats for the Big Ten teams. For the most part, we use Ken Pomeroy's excellent site as our stats resource, and we neither aspire to nor hope to duplicate (much less exceed) that effort. However, we thought we might be able to complement it at bit for Big Ten teams. When John Gasaway was knows as the Big Ten Wonk, he advocated that stats for conference games only were the real stuff when it game to useful data, given that most teams overall season numbers are possibly distorted by playing weak competition in the non-conference season. In fact, Gasaway continues to look at those numbers at Basketball Prospectus. We plan on doing some of that, and adding a little more.
First, here are the efficiency numbers for all of the Big Ten teams for conference games only. O Eff is offensive efficiency, or points per possession (PPP) scored. D Eff is defensive efficiency, or PPP allowed. Eff Margin is just O Eff - D Eff. The numbers in parentheses are the conference ranks for that column.
| Team | Tempo | O Eff | D Eff | Eff Margin |
| Michigan State | 63.7 (3) | 1.12 (1) | 0.96 (3) | 0.16 (1) |
| Purdue | 63.8 (2) | 1.03 (5) | 0.95 (2) | 0.08 (2) |
| Illinois | 61.0 (9) | 0.99 (7) | 0.94 (1) | 0.05 (3) |
| Ohio State | 63.6 (4) | 1.06 (3) | 1.02 (5) | 0.04 (4) |
| Wisconsin | 59.0 (10) | 1.08 (2) | 1.04 (7) | 0.04 (5) |
| Minnesota | 63.1 (5) | 0.99 (9) | 0.99 (4) | 0.00 (6) |
| Penn State | 62.0 (6) | 1.04 (4) | 1.05 (8) | -0.01 (7) |
| Michigan | 61.8 (7) | 0.99 (8) | 1.03 (6) | -0.04 (8) |
| Northwestern | 61.5 (8) | 1.02 (6) | 1.08 (9) | -0.06 (9) |
| Iowa | 58.2 (11) | 0.99 (10) | 1.08 (10) | -0.10 (10) |
| Indiana | 64.6 (1) | 0.94 (11) | 1.11 (11) | -0.17 (11) |
That's some good stuff, no? I thought about saving this next piece until the end, because it's without question the coup de grace and all, but it really belongs here. This is another Wonk construct. He used to post a graph showing where teams registered pictorially in terms of O Eff vs. D Eff. And since Lawton loves the charts, here is that very type of graph. (I'm hoping it won't look as crappy as I fear it will, but we'll see, and deal with it later if it does.)

But wait! There's more! Here are the offensive numbers. If you want some explanation, check them out here. The only difference is that these efficiency numbers are per possession rather than per 100 possessions. Conference ranks in parentheses.
Big Ten Offensive Stats
| Team | O Eff | eFG% | TO% | OR% | FTRate |
| Michigan State | 1.12 (1) | 50.2 (6) | 21.1 (7) | 45.6 (1) | 26.9 (3) |
| Wisconsin | 1.08 (2) | 50.7 (5) | 16.0 (1) | 29.9 (5) | 21.7 (8) |
| Ohio State | 1.06 (3) | 57.3 (1) | 21.9 (8) | 25.8 (10) | 27.1 (2) |
| Penn State | 1.04 (4) | 49.9 (7) | 18.2 (4) | 34.4 (3) | 20.1 (10) |
| Purdue | 1.03 (5) | 52.9 (2) | 20.7 (6) | 27.2 (9) | 28.0 (1) |
| Northwestern | 1.02 (6) | 51.6 (3) | 16.7 (2) | 19.8 (11) | 23.2 (6) |
| Illinois | 0.99 (7) | 47.8 (9) | 17.0 (3) | 28.5 (7) | 16.9 (11) |
| Michigan | 0.99 (8) | 47.1 (10) | 18.6 (5) | 29.2 (6) | 20.2 (9) |
| Minnesota | 0.99 (9) | 46.7 (11) | 22.6 (9) | 36.5 (2) | 22.6 (7) |
| Iowa | 0.99 (10) | 50.9 (4) | 24.1 (10) | 28.5 (8) | 26.0 (4) |
| Indiana | 0.94 (11) | 47.9 (8) | 25.1 (11) | 34.1 (4) | 23.8 (5) |
| Team | 2FG% | 3FG% | FT% | 3FGA/FGA | A/FGM |
| Michigan State | 48.7 (5) | 35.9 (6) | 70.3 (6) | 29.8 (11) | 60.3 (6) |
| Wisconsin | 49.0 (4) | 35.9 (6) | 75.7 (1) | 34.7 (5) | 53.8 (9) |
| Ohio State | 54.4 (1) | 41.8 (1) | 68.6 (10) | 34.3 (6) | 57.5 (7) |
| Penn State | 46.2 (9) | 37.1 (4) | 61.7 (11) | 39.6 (4) | 53.3 (10) |
| Purdue | 49.2 (3) | 40.3 (2) | 70.9 (5) | 32.8 (8) | 65.2 (4) |
| Northwestern | 48.5 (6) | 36.9 (5) | 69.3 (8) | 45.5 (3) | 67.3 (1) |
| Illinois | 49.3 (2) | 29.7 (11) | 73.6 (4) | 31.6 (10) | 66.0 (2) |
| Michigan | 48.3 (7) | 30.7 (10) | 75.0 (3) | 50.5 (1) | 65.8 (3) |
| Minnesota | 45.8 (10) | 32.5 (9) | 69.6 (7) | 33.0 (7) | 52.6 (11) |
| Iowa | 48.2 (8) | 35.8 (8) | 75.6 (2) | 48.6 (2) | 61.6 (5) |
| Indiana | 42.8 (11) | 39.2 (3) | 68.9 (9) | 32.4 (9) | 55.9 (8) |
That's not all! Here are the defensive numbers. Conference ranks in parentheses.
Big Ten Defensive Stats
| Team | D Eff | eFG% | TO% | OR% | FTRate |
| Illinois | 0.94 (1) | 45.3 (2) | 20.2 (5) | 32.8 (7) | 17.2 (1) |
| Purdue | 0.95 (2) | 45.2 (1) | 19.5 (7) | 30.5 (6) | 20.0 (3) |
| Michigan State | 0.96 (3) | 48.6 (4) | 20.1 (6) | 26.1 (3) | 22.9 (6) |
| Minnesota | 0.99 (4) | 46.9 (3) | 22.4 (2) | 36.0 (10) | 26.7 (8) |
| Ohio State | 1.02 (5) | 50.3 (6) | 22.1 (3) | 33.9 (9) | 20.3 (4) |
| Michigan | 1.03 (6) | 53.6 (10) | 20.2 (4) | 27.7 (4) | 19.2 (2) |
| Wisconsin | 1.04 (7) | 49.8 (5) | 16.4 (11) | 26.0 (1) | 26.8 (9) |
| Penn State | 1.05 (8) | 51.4 (7) | 18.5 (9) | 29.1 (5) | 21.7 (5) |
| Northwestern | 1.08 (9) | 52.7 (9) | 25.5 (1) | 41.0 (11) | 28.6 (10) |
| Iowa | 1.08 (10) | 51.8 (8) | 18.4 (10) | 33.7 (8) | 23.7 (7) |
| Indiana | 1.11 (11) | 56.6 (11) | 19.4 (8) | 26.0 (2) | 29.4 (11) |
| Team | 2FG% | 3FG% | FT% | 3FGA/FGA | A/FGM |
| Illinois | 44.3 (3) | 31.4 (1) | 62.8 (1) | 34.8 (9) | 59.1 (6) |
| Purdue | 41.2 (1) | 36.2 (7) | 68.2 (4) | 30.0 (11) | 62.7 (8) |
| Michigan State | 48.9 (6) | 32.1 (2) | 65.3 (2) | 41.9 (4) | 55.6 (2) |
| Minnesota | 43.5 (2) | 35.3 (5) | 74.0 (8) | 35.4 (7) | 56.8 (4) |
| Ohio State | 46.8 (4) | 36.8 (8) | 74.2 (9) | 41.9 (3) | 64.2 (10) |
| Michigan | 53.2 (9) | 36.2 (6) | 66.5 (3) | 35.7 (6) | 60.5 (7) |
| Wisconsin | 49.2 (7) | 33.9 (4) | 72.7 (7) | 33.3 (10) | 47.9 (1) |
| Penn State | 53.3 (10) | 32.1 (3) | 75.5 (11) | 36.8 (5) | 59.0 (5) |
| Northwestern | 47.3 (5) | 39.7 (10) | 74.3 (10) | 44.2 (1) | 71.6 (11) |
| Iowa | 49.7 (8) | 37.1 (9) | 69.3 (5) | 35.1 (8) | 56.4 (3) |
| Indiana | 53.9 (11) | 40.1 (11) | 72.1 (6) | 42.5 (2) | 64.1 (9) |
Monday, March 10, 2008
Big Ten Tempo-Free Stats Updated
We've posted the tempo-free Big Ten stats through the end of the regular season. We'll have to see whether we include the tournament numbers moving forward, but these encompass the entire conference slate.
Friday, March 7, 2008
Stats Update
We've once again updated the Big Ten tempo-free stats post, with data through 3/6/2008. We've also added some more data, just in case you're interested. Also, we're putting a sticky link to that page over in the sidebar so you can get back there more easily.
Monday, March 3, 2008
More Tempo-Free Stats Updates
We've updated the Big Ten tempo-free team stats through this weekend's games, and what a difference they made! On the strength of Purdue's play and the weakness of Indiana's, IU dropped from second to fourth in conference efficiency margin. I think that effect would be somewhat mitigated if we adopted kenpom's approach of averaging the game-by-game efficiency numbers instead of calculating one number based on overall possessions, and maybe we will in the future. But, for now, this is what we have. Enjoy.
Friday, February 29, 2008
Big Ten Tempo-Free Stats Updated
We've updated the Big Ten conference stats post through yesterday's games.
Tuesday, February 26, 2008
Tempo-Free Stats Updated
We've updated the Big Ten conference stats post with the weekend games. Not a huge difference, but Indiana and Northwestern's efficiency numbers both changed as a result of that no-D squeaker they played on Saturday night.
Friday, February 22, 2008
Big Ten by the Numbers
Update: We've updated the tempo-free conference numbers through games on 3/9/2008 (the end of the conference season).
We've been working on a little project here at SaWA to be able to look at stats for the Big Ten teams. For the most part, we use Ken Pomeroy's excellent site as our stats resource, and we neither aspire to nor hope to duplicate (much less exceed) that effort. However, we thought we might be able to complement it at bit for Big Ten teams. When John Gasaway was knows as the Big Ten Wonk, he advocated that stats for conference games only were the real stuff when it game to useful data, given that most teams overall season numbers are possibly distorted by playing weak competition in the non-conference season. In fact, Gasaway continues to look at those numbers (most recently here) at Basketball Prospectus. We plan on doing some of that, and adding a little more.
First, here are the efficiency numbers for all of the Big Ten teams for conference games only. O Eff is offensive efficiency, or points per possession (PPP) scored. D Eff is defensive efficiency, or PPP allowed. Eff Margin is just O Eff - D Eff. The numbers in parentheses are the conference ranks for that column.
| Team | Tempo | O Eff | D Eff | Eff Margin |
| Wisconsin | 60.1 (10) | 1.09 (1) | 0.91 (1) | 0.18 (1) |
| Purdue | 64.6 (3) | 1.05 (4) | 0.94 (2) | 0.12 (2) |
| Michigan State | 63.1 (6) | 1.06 (3) | 0.97 (4) | 0.09 (3) |
| Indiana | 64.8 (2) | 1.08 (2) | 1.01 (6) | 0.07 (4) |
| Ohio State | 63.4 (5) | 1.02 (5) | 0.95 (3) | 0.07 (5) |
| Illinois | 61.8 (8) | 0.99 (7) | 0.99 (5) | 0.00 (6) |
| Minnesota | 65.1 (1) | 1.01 (6) | 1.03 (8) | -0.02 (7) |
| Iowa | 59.2 (11) | 0.94 (11) | 1.02 (7) | -0.08 (8) |
| Michigan | 64.4 (4) | 0.96 (9) | 1.04 (9) | -0.08 (9) |
| Penn State | 62.0 (7) | 0.98 (8) | 1.12 (10) | -0.14 (10) |
| Northwestern | 61.2 (9) | 0.95 (10) | 1.16 (11) | -0.22 (11) |
That's some good stuff, no? I thought about saving this next piece until the end, because it's without question the coup de grace and all, but it really belongs here. This is another Wonk construct. He used to post a graph showing where teams registered pictorially in terms of O Eff vs. D Eff. And since Lawton loves the charts, here is that very type of graph. (I'm hoping it won't look as crappy as I fear it will, but we'll see, and deal with it later if it does.)
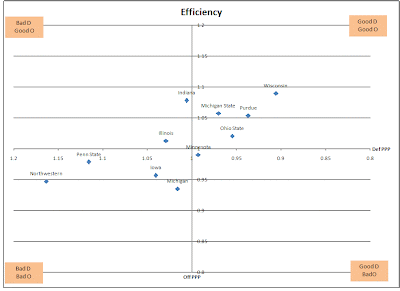
But wait! There's more! Here are the offensive numbers. If you want some explanation, check them out here. The only difference is that these efficiency numbers are per possession rather than per 100 possessions. Conference ranks in parentheses.
| Team | O Eff | eFG% | TO% | OR% | FTRate |
| Wisconsin | 1.09 (1) | 51.5 (3) | 18.7 (2) | 32.5 (6) | 30.1 (2) |
| Indiana | 1.08 (2) | 51.6 (2) | 20.7 (5) | 34.4 (3) | 30.5 (1) |
| Michigan State | 1.06 (3) | 52.2 (1) | 22.2 (10) | 35.9 (1) | 22.3 (8) |
| Purdue | 1.05 (4) | 49.8 (6) | 18.1 (1) | 31.3 (9) | 26.7 (3) |
| Ohio State | 1.02 (5) | 51.3 (4) | 20.8 (6) | 32.3 (7) | 18.7 (10) |
| Minnesota | 1.01 (6) | 49.7 (7) | 21.9 (9) | 34.0 (4) | 24.6 (4) |
| Illinois | 0.99 (7) | 48.8 (9) | 21.9 (8) | 35.1 (2) | 23.2 (6) |
| Penn State | 0.98 (8) | 48.5 (10) | 21.0 (7) | 32.0 (8) | 22.7 (7) |
| Michigan | 0.96 (9) | 45.1 (11) | 19.9 (4) | 33.5 (5) | 20.1 (9) |
| Northwestern | 0.95 (10) | 49.4 (8) | 19.3 (3) | 21.8 (11) | 14.3 (11) |
| Iowa | 0.94 (11) | 50.6 (5) | 25.0 (11) | 26.9 (10) | 23.8 (5) |
| Team | 2FG% | 3FG% | FT% | 3FGA/FGA | A/FGM |
| Wisconsin | 48.8 (5) | 37.8 (3) | 73.8 (2) | 33.4 (10) | 54.5 (9) |
| Indiana | 53.0 (2) | 32.8 (8) | 77.9 (1) | 38.1 (6) | 52.6 (11) |
| Michigan State | 51.2 (3) | 36.7 (4) | 72.0 (3) | 26.2 (11) | 69.7 (2) |
| Purdue | 43.7 (11) | 39.6 (1) | 71.9 (4) | 39.0 (5) | 63.5 (5) |
| Ohio State | 53.6 (1) | 31.6 (10) | 69.6 (6) | 37.6 (7) | 54.0 (10) |
| Minnesota | 45.6 (9) | 38.1 (2) | 66.6 (8) | 35.4 (8) | 65.5 (4) |
| Illinois | 48.7 (6) | 32.6 (9) | 62.2 (11) | 35.2 (9) | 61.8 (6) |
| Penn State | 45.7 (8) | 35.1 (5) | 63.0 (10) | 39.9 (4) | 56.7 (7) |
| Michigan | 45.3 (10) | 30.0 (11) | 70.1 (5) | 43.1 (3) | 56.0 (8) |
| Northwestern | 47.4 (7) | 34.7 (6) | 67.0 (7) | 43.8 (2) | 71.0 (1) |
| Iowa | 49.5 (4) | 34.6 (7) | 65.7 (9) | 47.6 (1) | 67.2 (3) |
That's not all! Here are the defensive numbers. Conference ranks in parentheses.
| Team | D Eff | eFG% | TO% | OR% | FTRate |
| Wisconsin | 0.91 (1) | 44.2 (1) | 20.1 (6) | 29.7 (5) | 17.1 (1) |
| Purdue | 0.94 (2) | 47.9 (5) | 26.0 (1) | 33.0 (7) | 31.6 (11) |
| Ohio State | 0.95 (3) | 45.6 (2) | 21.9 (5) | 34.5 (9) | 18.1 (2) |
| Michigan State | 0.97 (4) | 47.0 (3) | 17.9 (9) | 29.1 (2) | 22.3 (7) |
| Illinois | 0.99 (5) | 47.2 (4) | 19.8 (7) | 29.5 (4) | 31.2 (10) |
| Indiana | 1.01 (6) | 48.7 (7) | 17.2 (11) | 28.1 (1) | 19.1 (3) |
| Iowa | 1.02 (7) | 48.0 (6) | 17.4 (10) | 29.4 (3) | 20.2 (5) |
| Minnesota | 1.03 (8) | 51.3 (8) | 23.8 (2) | 35.8 (10) | 28.8 (8) |
| Michigan | 1.04 (9) | 53.1 (9) | 22.2 (4) | 33.0 (8) | 20.1 (4) |
| Penn State | 1.12 (10) | 56.2 (10) | 19.0 (8) | 31.2 (6) | 20.2 (6) |
| Northwestern | 1.16 (11) | 59.8 (11) | 23.5 (3) | 39.2 (11) | 30.7 (9) |
| Team | 2FG% | 3FG% | FT% | 3FGA/FGA | A/FGM |
| Wisconsin | 42.9 (1) | 31.1 (1) | 68.2 (4) | 33.6 (10) | 50.0 (1) |
| Purdue | 47.0 (7) | 33.2 (4) | 69.6 (5) | 31.8 (11) | 60.5 (7) |
| Ohio State | 44.3 (2) | 31.6 (3) | 73.4 (11) | 41.6 (3) | 64.5 (9) |
| Michigan State | 46.8 (5) | 31.5 (2) | 65.5 (2) | 38.2 (6) | 59.8 (5) |
| Illinois | 44.7 (3) | 34.2 (6) | 71.1 (9) | 37.0 (7) | 54.9 (2) |
| Indiana | 46.9 (6) | 34.3 (7) | 63.8 (1) | 40.0 (4) | 59.3 (4) |
| Iowa | 46.4 (4) | 34.1 (5) | 72.6 (10) | 34.3 (9) | 59.3 (3) |
| Minnesota | 50.4 (8) | 35.2 (8) | 70.6 (7) | 39.4 (5) | 60.0 (6) |
| Michigan | 50.8 (9) | 38.0 (10) | 66.0 (3) | 36.6 (8) | 62.8 (8) |
| Penn State | 56.2 (10) | 37.5 (9) | 70.2 (6) | 42.0 (2) | 65.9 (10) |
| Northwestern | 59.4 (11) | 40.2 (11) | 71.0 (8) | 43.1 (1) | 71.1 (11) |
Subscribe to:
Posts (Atom)
